
Official websites use .gov
A
.gov
website belongs to an official government organization in the
United States.
Secure .gov websites use HTTPS
A
lock
(
) or
https://
means you’ve safely connected to the .gov website. Share sensitive
information only on official, secure websites.
Electronic Public Health Reporting among Non-Federal Acute Care Hospitals During the COVID-19 Pandemic, 2021
No. 62 | September 2022
- Electronic Public Health Reporting among Non-Federal Acute Care Hospitals During the COVID-19 Pandemic, 2021
- Data Brief 62 Figure 1
- Data Brief 62 Figure 2 – Top Panel
- Data Brief 62 Figure 2 – Bottom Panel
- Data Brief 62 Figure 3
- Data Brief 62 Figure 4
- Data Brief 62 Figure 5
- Data Brief 62 Figure 6
- Data Brief 62 Figure 7
Hospitals play an important role in support of public health functions by contributing timely and accurate data to state and local public health agencies (PHAs). However, the COVID-19 pandemic revealed substantive gaps in our public health infrastructure. To ensure that PHAs have the information they need for effective disease surveillance and pandemic response, national efforts are underway to incentivize electronic public health reporting and improve methods of health information exchange between the healthcare delivery system and PHAs. This data brief uses nationally representative survey data from the American Hospital Association (AHA) Information Technology (IT) supplement to describe hospitals’ engagement towards electronically submitting data for public health reporting during the COVID-19 pandemic. This descriptive analysis provides context for some of the challenges hospitals experienced with public health reporting in 2019 and sheds light on hospitals’ current capacity to support ongoing pandemic response efforts and future public health emergencies.
Highlights
- In 2021, most non-federal acute care hospitals reported electronically submitting data for at least one type of public health reporting (89%), and on average, were actively submitting data for 4 out of 6 reporting types.
- Despite high rates of electronic public health reporting at the national level, rates varied by reporting type, geographic location, and hospital characteristics.
- Hospitals that experienced major public health reporting challenges in 2019 were less likely to be engaged in certain types of electronic public health reporting in 2021.
- Most hospitals mainly used an electronic health record (EHR) system and fully or primarily automated processes to submit data for public health reporting.
- About 2 in 5 hospitals used a health information exchange (HIE) organization to submit data for at least one type of public health reporting. The degree to which hospitals used HIEs to facilitate electronic reporting varied widely by state.
In 2021, a majority of non-federal acute care hospitals were actively electronically submitting data for at least one type of public health reporting.
Findings
- More than three-quarters of non-federal acute care hospitals were actively electronically submitting data for immunization registry reporting (88%), syndromic surveillance reporting (81%), and electronic laboratory (lab) result reporting (81%) in 2021.
- Most non-federal acute care hospitals reported electronically submitting data for public health registry reporting (59%), however, less than half were actively engaged in electronic case reporting (47%) or clinical data registry reporting (46%).
- As of 2021, a quarter of hospitals had not completed registration for electronic case reporting and clinical data registry reporting.
- Approximately a quarter of non-federal acute care hospitals nationally were actively engaged in electronic public health reporting for all reporting types in 2021 (24%).
Table 1: Non-federal acute care hospitals’ current stage of active engagement towards electronically submitting data for public health reporting, 2021.
| Actively electronically submitting production data | In the process of testing and validating electronic submission of data | Completed registration to submit data | Have not completed registration | Don’t know | |
|---|---|---|---|---|---|
| Immunization registry reporting | 88% | 3% | 3% | 2% | 4% |
| Syndromic surveillance reporting | 81% | 3% | 3% | 4% | 9% |
| Electronic lab reporting | 79% | 5% | 5% | 3% | 8% |
| Public health registry reporting | 59% | 2% | 4% | 17% | 18% |
| Electronic case reporting | 47% | 4% | 4% | 24% | 22% |
| Clinical data registry reporting | 46% | 2% | 3% | 27% | 23% |
| At least one reporting type | 89% |
|---|---|
| All reporting types | 24% |
Notes: Missing values (syndromic surveillance reporting, N=106; immunization registry reporting, N =106; electronic case reporting, N =149; public health registry reporting, N =149; clinical data registry reporting, N =146; electronic lab result reporting, N =126) ) were excluded from the denominator.
Hospitals that experienced public health reporting challenges in 2019 were less likely to be engaged in certain types of electronic public health reporting in 2021.
Findings
- In 2019, 71 percent of non-federal acute care hospitals reported experiencing at least one major challenge when trying to submit health information to PHAs to meet reporting requirements.
- In 2021, hospitals that experienced public health reporting challenges in 2019 were significantly less likely to be electronically submitting production data for immunization registry reporting (86%), syndromic surveillance reporting (78%), electronic case reporting (47%), and clinical data registry reporting (53%) compared to those who did not report any major challenge.
Figure 1: Percent of non-federal acute care hospitals actively engaged in electronic public health reporting in 2021 by whether they experienced a public health reporting challenge in 2019.

Notes: Only includes hospitals that responded in 2019 and 2021 (N= 1,937). Missing values were excluded from the denominator. * Indicates statistical significance at the 5% level (p < 0.05). More information on the challenges hospitals faced with public health reporting in the year prior to the pandemic can be found in the data brief, “Challenges to Public Health Reporting Experienced by Non-federal Acute Care Hospitals, 2019”.
Rates of electronic public health reporting varied by state and by reporting type.
Findings
- A few states performed consistently well across reporting types (e.g., VA, DE, ND) while others under-performed across multiple reporting types (e.g., UT, HI, NM) (Appendix Table A1).
- Hospital reporting of some types, such as electronic case reporting (Range: 11%-89%) was more varied across states than other reporting types, such as syndromic surveillance (Range: 31%-100%). Other state-level estimates are reported in Appendix Table A1.
Figure 2: Percent of non-federal acute care hospitals actively engaged in syndromic surveillance and electronic case reporting, by state, 2021.
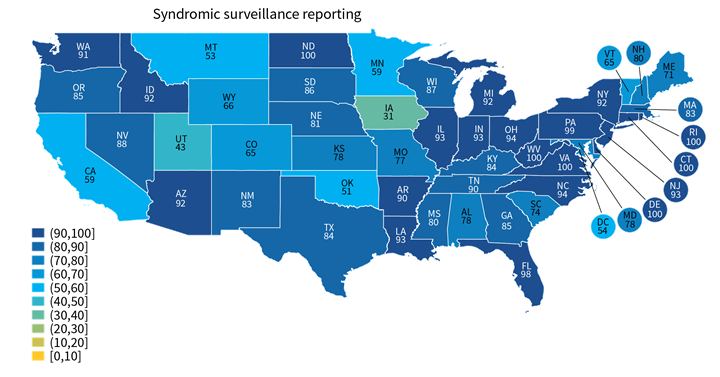
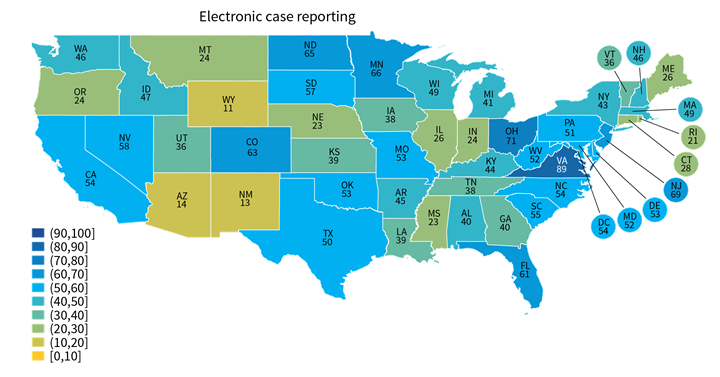
Notes: Only includes hospitals that were actively electronically submitting production data for each public health reporting type. Missing values were excluded from denominator. State-level rates for all reporting types are reported in in Appendix Table A1.
On average, non-federal acute care hospitals were actively submitting data electronically for 4 out of 6 types of public health reporting.
Findings
- Small, rural, independent, critical access hospitals were engaged in fewer types of electronic public health reporting compared to their higher-resourced counterparts.
- Non-teaching and minor teaching hospitals were engaged in fewer types of electronic public health reporting activities compared to major teaching hospitals.
- Hospitals without certified EHRs were only actively submitting data electronically for about 2 public health reporting types compared to nearly 4 reporting types among hospitals with EHRs that meet the Office of the National Coordinator for Health Information Technology’s (ONC) certification requirements.
Table 2: Mean number of public health reporting types among hospitals actively engaged in electronic reporting, 2021.
| Hospital Characteristics | Mean Number of Reporting Types (out of 6) |
|---|---|
| Small (N = 1,047) | 3.6* |
| Medium or Large (N = 1,317) | 4.3 |
| CAH (N = 611) | 3.5* |
| non-CAH (N = 1,753) | 4.1 |
| Rural (N = 827) | 3.6* |
| Suburban-Urban (N = 1,537) | 4.2 |
| Independent (N = 645) | 3.5* |
| System Affiliation (N = 1,719) | 4.1 |
| Non-teaching hospital (N = 1,142) | 3.7* |
| Minor teaching hospital (N = 1,035) | 4.2* |
| Major teaching hospital (N = 187) | 4.6 |
| Not certified (N = 121) | 2.4* |
| Certified EHR (N = 2,243) | 4.0 |
| National Average | 3.9 |
Notes: The number of reporting types ranges from 0 (if not actively engaged in any type of electronic public health reporting) to 6 (if actively engaged in all 6 types). Hospitals were excluded from the denominator if responses to all public health reporting questions were blank (4%). * Indicates statistical significance at the 5% level (p < 0.05).
Almost a quarter of non-federal acute care hospitals indicated their EHR developer charged them separately to submit data for public health reporting.
Findings
- While most hospitals indicated that their EHR developers does not charge additionally to submit data for public health reporting (62%), nearly a quarter reported that their EHR developer charged separately for this service (i.e., either because the service was available as an add-on or included in a larger package) and 14 percent indicated they don’t know (Figure 3).
- Hospitals that indicated they used EHR developers that charged separately for public health reporting had significantly lower rates of electronic clinical data registry reporting, electronic case reporting, and electronic public health registry reporting compared to those whose EHR developer did not charge separately for this service (Figure 4).
- Hospital reports of being charged separately for public health reporting also varied by developer, ranging from 14 to 43 percent (Appendix Table A2).
Figure 3: Percent of non-federal acute care hospitals whose EHR developer charged separately to submit data for public health reporting activities, 2021

Figure 4: Percent of non-federal acute care hospitals actively engaged in electronic public health reporting by whether their EHR developer charged separately to submit data for public health reporting activities, 2021

Notes: The share of EHR developers charging separately for public health reporting activities was derived from the survey question: “Does your EHR developer charge your hospital additionally to submit data for public health reporting activities?” Missing values excluded from denominator. * Indicates statistical significance at the 5% level (p < 0.05).
Small, rural, independent, and critical access hospitals were more likely to indicate their EHR developer charged separately for public health reporting.
Findings
- Lower-resourced hospitals were more likely to indicate their EHR developer charged separately for public health reporting compared to their higher-resourced counterparts. However, these hospitals were also less like to know whether their EHR developer charged separately for this service.
- Independent (non-system affiliated) hospitals were most likely to indicate their EHR developer charged separately for public health reporting (33%).
Table 3: Percent of non-federal acute care hospitals whose EHR developer charged separately to submit data for public health reporting activities, by hospital characteristics, 2021.
| Hospital Characteristics | Yes, charges separately | No, does not charge separately | Don’t know |
|---|---|---|---|
| Small (N = 1,047) | 26%* | 55%* | 19%* |
| Medium or Large (N = 1,317) | 20% | 70% | 10% |
| CAH (N = 611) | 28%* | 52%* | 20%* |
| non-CAH (N = 1,753) | 21% | 67% | 12% |
| Rural (N = 827) | 27%* | 53%* | 20%* |
| Suburban-Urban (N = 1,537) | 20% | 69% | 11% |
| Independent (N = 645) | 33%* | 50%* | 17%* |
| System Affiliation (N = 1,719) | 19% | 68% | 13% |
| All hospitals | 23% | 62% | 14% |
Notes: Missing values excluded from denominator. * Indicates statistical significance at the 5% level (p < 0.05).
About four-in-ten non-federal acute care hospitals used an HIE for at least one type of public health reporting.
Findings
- In 2021, approximately 41 percent of non-federal acute care hospitals used an HIE to submit data for at least one type of public health reporting.
- While most hospitals that used an HIE for reporting indicated they leveraged HIE services for simple pass through or transmission of data, nearly 1 in 5 hospitals that used an HIE indicated the HIE performed simple modifications (e.g., code translation) or other value-added services (e.g., adding information from another source) (Appendix Table A3).
- Hospitals’ use of HIEs for public health reporting varied at the state-level, ranging from 5 percent of hospitals in Connecticut to 100 percent of hospitals in Maryland (Appendix Table A4).
Figure 5: Percent of non-federal acute care hospitals in each state that use an HIE to submit data for at least one public health reporting activity, 2021.
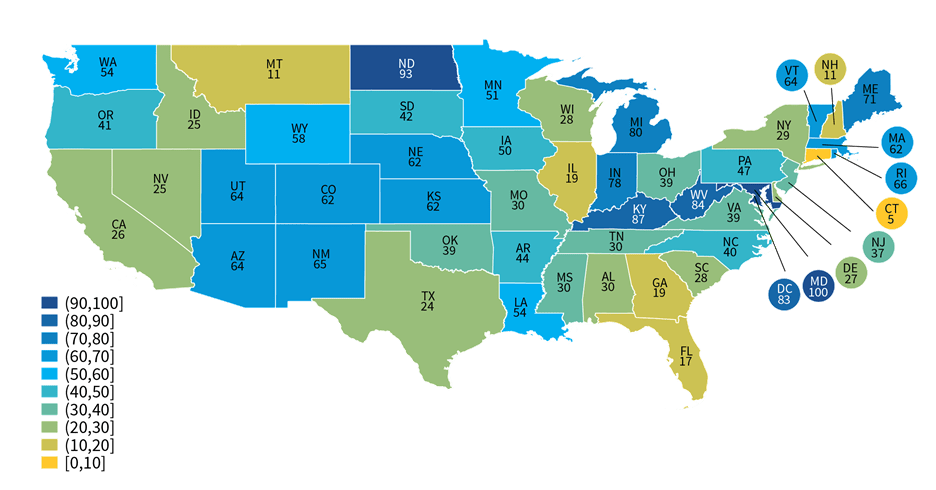
Notes: The use of an HIE for at least one type of public health reporting was determined based on responses to the question: “If you use an HIE to submit data for public health reporting activities, does the HIE perform value added services during submission?” Any responses to this question, including “don’t know”, were counted as using an HIE for public health reporting. Missing values and “not applicable” responses were counted as not using an HIE for any public health reporting.
Most hospitals that engaged in electronic public health reporting in 2021 mainly used an EHR to submit data directly to PHAs.
Findings
- About 12 to 15 percent of hospitals engaged in electronic public health reporting indicated they mainly relied on HIEs to facilitate transmission of data to PHAs.
- While few hospitals engaged in electronic reporting relied on electronic methods other than using their EHR or leveraging HIEs to submit data to PHAs, other electronic methods were mainly used by 1 in 5 hospitals for public health registry reporting and by more than a quarter of hospitals for clinical data registry reporting.
- In contrast to the main methods used for electronic public health reporting, nearly three-quarters of hospitals mainly used other electronic methods for reporting on hospital capacity and utilization of medical supplies. Less than a quarter of hospitals mainly used an EHR to submit hospital capacity data directly and only 5 percent mainly used an HIE to facilitate data transmission.
Figure 6: Percent of non-federal acute care hospitals using mainly an EHR, HIE, or other electronic method to submit data for public health and hospital capacity reporting, 2021.
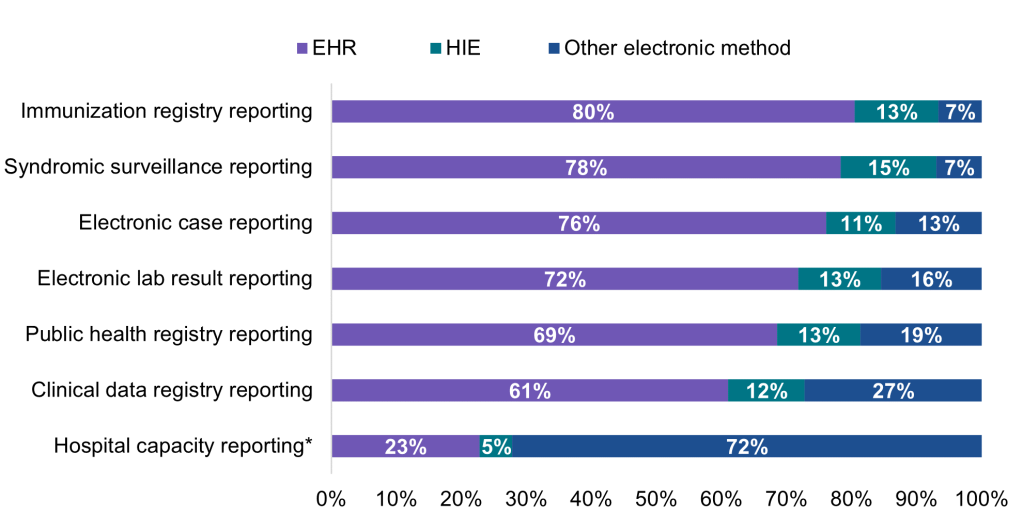
Notes: This question refers to production data generated through clinical processes involving patient care (NOT test data). Respondents were asked to select only one option most frequently used in each row (i.e., the primary method used for reporting). Public health reporting estimates only include respondents that were “actively electronically submitting production data” for the respective reporting type. Hospital capacity reporting estimates include all respondents. For all reporting types, missing values, “don’t know” responses, and not applicable responses (i.e., not electronically submitting data) were excluded from the denominator. * During the COVID-19 pandemic, U.S. hospitals were required to report data associated with hospital capacity and utilization of medical supplies to assist the government with allocating resources. In calculating methods used for electronic hospital capacity reporting, missing values (N = 183), “don’t know” responses (N = 367), and not applicable responses (i.e., not electronically submitting data, N = 405) were excluded from the denominator.
Small, rural, independent, and critical access hospitals were more likely to rely on HIEs to submit data for public health reporting compared to their counterparts.
Findings
- Overall, 17% of non-federal acute care hospitals mainly used an HIE to submit data for at least one type of public health reporting in 2021.
- Small, rural, independent, and critical access hospitals were significantly more likely to rely on HIEs to facilitate transmission of data to PHAs compared to their higher-resourced counterparts, and less likely to submit data directly through EHRs.
- Non-teaching hospitals, minor teaching hospitals, and hospitals without a certified EHR were significantly less likely to rely on any electronic method (EHR, HIE, or other) for public health reporting compared to major teaching hospitals and hospitals with certified EHRs, respectively.
Table 4: Main method used for at least one type of public health reporting, by hospital characteristics.
| Hospital Characteristics | EHR | HIE | Other electronic method |
|---|---|---|---|
| Small (N = 1,047) | 68%* | 19%* | 23% |
| Medium or Large (N = 1,317) | 81% | 15% | 24% |
| CAH (N = 611) | 70%* | 21%* | 23% |
| non-CAH (N = 1,753) | 76% | 15% | 24% |
| Rural (N = 827) | 67%* | 20%* | 23% |
| Suburban-Urban (N = 1,537) | 79% | 15% | 24% |
| Independent (N = 645) | 64%* | 20%* | 22% |
| System Affiliation (N = 1,719) | 80% | 15% | 25% |
| Non-teaching hospital (N = 1,142) | 70%* | 18% | 24%* |
| Minor teaching hospital (N = 1,035) | 79%* | 15% | 22%* |
| Major teaching hospital ¥ (N = 187) | 85% | 19% | 31% |
| Not certified (N = 121) | 13%* | 6%* | 13%* |
| Certified EHR (N = 2,243) | 79% | 18% | 24% |
| All hospitals | 74% | 17% | 24% |
Notes: The numerator only includes respondents that reported “actively electronically submitting production data” for the respective reporting type. The denominator includes all hospital respondents. * Indicates statistical significance at the 5% level (p < 0.05). ¥ Indicates reference category.
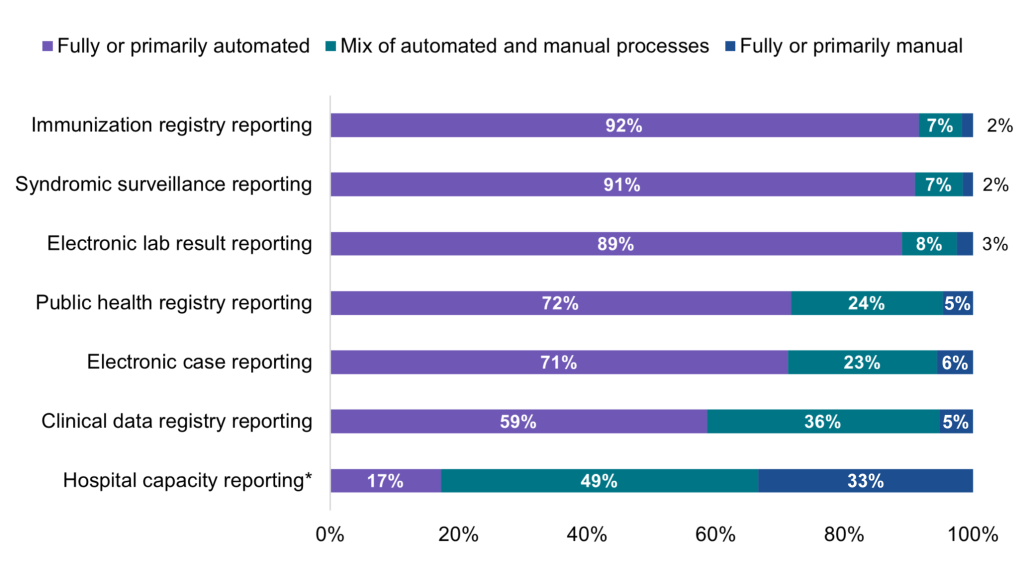
A majority of hospitals that electronically submitted data to PHAs in 2021 used fully or primarily automated processes for public health reporting.
Findings
- A mix of automated and manual processes were used by nearly a quarter of hospitals that were electronically submitting data for public health registry reporting (24%) and electronic case reporting (23%) and by one-third of hospitals that were electronically submitting data for clinical data registry reporting (36%).
- Unlike public health reporting, less than 1 in 5 hospitals reported using fully or primarily automated processes to submit data on hospital capacity and utilization of medical supplies.
- Rates of automated reporting among hospitals that were electronically submitting data also varied by state (Appendix Table A5).
Figure 7: Percent of non-federal acute care hospitals using automated, manual, or a mix of both types of processes to transmit data for public health and hospital capacity reporting, 2021.
Notes: Hospitals were asked whether they used automated (e.g., EHR generated data sent electronically/automatically to the public health agency), manual (e.g., chart abstraction with data faxed or re-input into a portal), or a mix of both types of processes (e.g., files electronically generated from the EHR, but manual steps required to transmit to public health agency) to transmit data for public health reporting. Public health reporting estimates only include respondents that were “actively electronically submitting production data” for the respective reporting type. Hospital capacity reporting estimates include all respondents. For all reporting types, missing values and “don’t know/NA” responses were excluded from the denominator. * During the COVID-19 pandemic, U.S. hospitals were required to report data associated with hospital capacity and utilization of medical supplies to assist the government with allocating resources.
A high proportion of hospitals that mainly used an EHR for electronic reporting had automated processes in place for all 6 types of public health reporting.
Findings
- Hospitals mainly using an HIE—typically small, rural, independent, and critical access hospitals—for immunization registry reporting, electronic case reporting, and public health registry reporting were significantly less likely to be using fully or primarily automated processes to transmit data to PHAs compared to those who mainly used an EHR.
- However, there were no significant differences in the proportion of hospitals using fully or primarily automated processes for syndromic surveillance, clinical registry, and electronic lab result reporting among those who mainly used an HIE vs. an EHR for electronic reporting.
- Hospitals mainly using any other electronic method (apart from EHR or HIE) were significantly less likely to be using fully or primarily automated processes to submit data to PHAs for all types of reporting compared to those who mainly used an EHR.
Table 5: Percent of non-federal acute care hospitals using fully or primarily automated processes to transmit data by primary method of public health reporting, 2021.
| Reporting Type | EHR | HIE | Other electronic method |
|---|---|---|---|
| Immunization registry reporting | 95% | 89%* | 57%* |
| Syndromic surveillance reporting | 94% | 92% | 53%* |
| Electronic lab reporting | 92% | 88% | 76%* |
| Public health registry reporting | 82% | 71%* | 39%* |
| Electronic case reporting | 81% | 67%* | 25%* |
| Clinical data registry reporting | 72% | 63% | 29%* |
Notes: Only includes respondents that reported “actively electronically submitting production data” for the respective reporting type. Missing and “don’t know/NA” responses were excluded from the denominator. * Indicates statistical significance at the 5% level (p < 0.05); EHR is the reference category.
Summary
In 2021, during the pandemic, most non-federal acute care hospitals (89%) were electronically submitting data for at least one type of public health reporting, of which, a majority used fully or primarily automated processes to transmit data to PHAs. However, rates of electronic public health reporting varied across the six public health reporting types we examined. Most hospitals were electronically submitting data for reporting types that tend to be required and have the health IT infrastructure in place to support electronic reporting—i.e., immunization registry reporting (88%), syndromic surveillance reporting (81%), and electronic lab result reporting (81%). In contrast, while state laws require health care providers to report cases of notifiable diseases to PHAs, rates of electronic case reporting remain low (47%) as the health IT infrastructure to support electronic case reporting is in its early stages. However, rates will likely increase due to the increased focus on having timely data available to support pandemic response. Rates of electronic reporting were notably lower for optional types of electronic reporting: less than two-thirds of hospitals were electronically submitting data for public health registry reporting (59%) and less than half were electronically submitting data for clinical data registry reporting (46%). Hospitals’ rates of electronic reporting to PHAs also varied by state, hospital characteristics, and by experience with barriers to public health reporting.
A combination of incentives and requirements are in place to engage health care providers in electronic public health reporting. To help improve rates of electronic public health reporting for types that are not typically mandated by states, nationwide efforts are underway to incentivize hospitals to engage in a broader array of electronic public health reporting. As of January 2022, syndromic surveillance reporting, immunization registry reporting, electronic case reporting, and electronic reportable laboratory result reporting are now required by the Centers for Medicare & Medicaid Services’ Medicare Promoting Interoperability Program for eligible hospitals and critical access hospitals. Public health registry and clinical data registry reporting measures remain optional, yet available for additional bonus points (3). In 2020, ONC released information blocking provisions in the Cures Act Final Rule which preclude actors from engaging in practices that are likely to interfere with the access, exchange, or use of electronic health information. In cases where state law requires actors to submit electronic health information to PHAs, failure to submit this information could be considered an interference to the access, exchange, or use of electronic health information (4).
Nationally, lower-resourced hospitals (i.e., small, rural, independent, critical access hospitals) were engaged in fewer types of electronic public health reporting, on average, compared to their higher-resourced counterparts. This may be related, in part, to the price structure used by EHR developers to charge for public health reporting activities or the type of contract a given customer has chosen (e.g., purchase of full enterprise software suites versus select modules). For instance, costs associated with public health reporting services may be bundled or priced separately (i.e., “charged additionally”) from other base services, which may affect hospitals’ decisions to add on these services – particularly for optional reporting types. Compared to nearly a quarter of hospitals nationally, we found that lower-resourced hospitals were more likely to indicate their EHR developer charged separately for public health reporting—which was associated with significantly lower rates of clinical data registry reporting, electronic case reporting, and public health registry reporting compared to hospitals whose EHR developer did not charge separately. These findings suggest that additional costs incurred to submit data for public health reporting activities may hinder engagement in certain types of electronic public health reporting – particularly those that are not mandatory (e.g., public health and clinical data registry reporting). Further work is needed to understand how state policies and different pricing structures contribute to the variation in fees charged for public health reporting.
Active engagement in public health reporting was also lower among hospitals that experienced major public health reporting challenges in 2019 prior to the pandemic such as hospitals’ or PHAs’ lack of resources or technical capacity to exchange, interface-related issues that make it difficult to send information, and use of different vocabulary standards (5). Numerous HHS efforts are in place to address these challenges and improve the flow of information between health care providers and PHAs. For instance, efforts to promote data standardization, such as ONC’s certification criteria, support public health reporting by enabling the exchange of health information for public health purposes (e.g., transmission of data to immunization registries or cancer registries; transmission of syndromic surveillance data, electronic case reports, and reportable lab results to PHAs). These functionalities may help enable greater automation as automated processes were more common among hospitals that mainly used an EHR for public health reporting (e.g., EHR data is sent automatically to PHAs) compared to those who mainly used other methods.
ONC is also working to advance standards to facilitate the exchange of information between health care providers and PHAs through USCDI+, an initiative aimed at identifying and establishing public health specific datasets that will operate as extensions to the existing USCDI (6). The Centers for Disease Control and Prevention’s (CDC) Data Modernization Initiative (DMI) aims to improve data sharing and interoperability of public health data systems by adopting these standards for data access and exchange, reducing burden on clinicians who collect and report information to public health, and developing a skilled public health workforce to sustain these efforts. In support of DMI, ONC partnered with CDC to support the Helios FHIR accelerator program aimed at advancing interoperability for public health through the use of Health Level 7 (HL7®) Fast Healthcare Interoperability Resources (FHIR®) standard for the exchange of public health data. ONC and CDC are also engaged in a joint effort to create a common public health data infrastructure (referred to as North Star Architecture) that supports system integration and seamless data sharing across all levels of government.
About four in ten hospitals reported using an HIE for at least one of six public health reporting types; however, only about one in five mainly relied on HIEs for public health reporting. Among hospitals that were electronically reporting to PHAs, most indicated they mainly used an EHR to directly submit data to PHAs for each reporting type (ranging from 61 percent of hospitals for clinical data registry reporting to 80 percent of hospitals for immunization registry reporting). HIE use varied geographically—ranging from five to 100 percent of hospitals in a given state—which may reflect differences in state requirements for public health reporting. For instance, some states—such as Maryland—require hospitals to use their state’s designated HIE for public health reporting. Small, rural, independent, and critical access hospitals were more likely to mainly use HIEs for public health reporting compared to their higher-resourced counterparts. While most hospitals that used an HIE for reporting leveraged their services for simple pass through or transmission of data, about 1 in 5 hospitals that used an HIE indicated the HIE performed simple modifications (e.g., code translation) or other value-added services (e.g., adding information from another source) to facilitate reporting to PHAs.
Taken together, these findings illustrate the important role HIEs play in facilitating public health reporting for lower-resourced hospitals. They also highlight the importance of ONC’s ongoing efforts to support HIEs as they develop tools and strategies to facilitate public health reporting through the Strengthening the Technical Advancement and Readiness of Public Health via Health Information Exchange Program (STAR HIE Program). For instance, several STAR HIE program awardees including Georgia Health Information Network, Health Current Arizona, and Texas Health Services Authority have specifically worked with hospitals to create new connections to public health; improve the timeliness, accuracy, and completeness of hospital reporting (e.g., by ensuring data fields are appropriately mapped, expanding interfaces to other hospitals systems, and supplying tracking applications for hospital capacity data); and facilitate the automated exchange of hospital capacity and other situational awareness data (7). ONC’s Trusted Exchange Framework and Common Agreement (TEFCA) will also help facilitate public health agencies’ ability to exchange information with health care provider organizations. ONC is working with public health stakeholders to build standard operating procedures (SOPs) and implementation guides for public health use cases in TEFCA.
Unlike public health reporting, only about a quarter of hospitals that reported hospital capacity data electronically mainly used an EHR or HIE to submit data. Hospital capacity and utilization of medical supplies data were largely transmitted using fully or primarily manual processes (33%) or a mix of automated and manual processes (49%). Reporting on hospital capacity and utilization of medical supplies was a reporting requirement that started during the COVID-19 pandemic to assist the government with resource allocation. Hospital capacity reporting is not part of ONC certification, and the reporting methods vary (8). Efforts are ongoing to develop a standards-based approach to real-time reporting of hospital capacity data using the Situation Awareness for Novel Epidemic Response (SANER) Implementation Guide (IG) – which can help support communication of situational awareness data and reduce reporting burden for hospitals (9). The SANER IG was developed out of a multi-pronged effort to improve hospital capacity reporting capabilities to PHAs through the modernization of existing public health data systems and processes (10). While SANER has not yet been put into production by hospitals, adoption and use of this or a similar specification among hospitals could help facilitate the flow of structured situational awareness data to public health.
As several new initiatives and incentive program requirements begin to take effect, it will be important for researchers and policymakers to continuously monitor whether these efforts help to increase public health reporting among lower-resourced hospitals and improve rates of automation and successful data submissions for activities that lag behind other public health reporting types.
Definitions
Critical Access hospital (CAH): Hospitals with less than 25 beds and at least 35 miles away from another general or critical access hospital.
Health information exchange (HIE): State, regional, or local health information network. This does not include local proprietary or enterprise networks.
Non-federal acute care hospital: Hospitals that meet the following criteria: acute care general medical and surgical, children’s general, and cancer hospitals owned by private/not-for-profit, investor-owned/for-profit, or state/local government and located within the 50 states and District of Columbia.
Public Health Agency (PHA): state and local public health agencies support interoperability efforts and data exchange with electronic health records, many of which have been utilized by the Centers for Medicare & Medicaid Services (CMS) Promoting Interoperability Programs.
Rural hospital: Hospitals located in a non-metropolitan statistical area.
Small hospital: Non-federal acute care hospitals of bed sizes of 100 or less.
System Affiliated Hospital: A system is defined as either a multi-hospital or a diversified single hospital system. A multi-hospital system is two or more hospitals owned, leased, sponsored, or contract managed by a central organization. Single, freestanding hospitals may be categorized as a system by bringing into membership three or more, and at least 25 percent, of their owned or leased non-hospital pre-acute or post-acute health care organizations.
Data Source and Methods
Data are from the American Hospital Association (AHA) Information Technology (IT) Supplement to the AHA Annual Survey. Since 2008, ONC has partnered with the AHA to measure the adoption and use of health IT in U.S. hospitals. ONC funded the 2019 AHA IT Supplement to track hospital adoption and use of EHRs and the exchange of clinical data.
The chief executive officer of each U.S. hospital was invited to participate in the survey regardless of AHA membership status. The person most knowledgeable about the hospital’s health IT (typically the chief information officer) was requested to provide the information via a mail survey or secure online site. Non-respondents received follow-up mailings and phone calls to encourage response.
This brief reports results from the 2019 and 2020 AHA IT Supplement. The 2019 survey was fielded from January 2020 to June 2020. Due to pandemic-related delays, the 2020 survey was not fielded on time and was fielded from April 2021 to September 2021. Since the IT supplement survey instructed respondents to answer questions as of the day the survey is completed, we refer to responses to the 2020 IT supplement survey as happening in 2021 in this brief. The response rate for non-federal acute care hospitals for the 2020 survey was 54 percent. A logistic regression model was used to predict the propensity of survey response as a function of hospital characteristics, including size, ownership, teaching status, system membership, and availability of a cardiac intensive care unit, urban status, and region. Hospital-level weights were derived by the inverse of the predicted propensity.
References
- Scharf, L.G., Coyle, R., Adeniyi, K., Fath, J., Harris, L., Myerburg, S., Kurilo, M.B. and Abbott, E., 2021. Current challenges and future possibilities for immunization information systems. Academic Pediatrics, 21(4), pp.S57-S64.
- Martin, D.W., Lowery, N.E., Brand, B., Gold, R. and Horlick, G., 2015. Immunization information systems: a decade of progress in law and policy. Journal of public health management and practice: JPHMP, 21(3), p.296.
- Centers for Medicare & Medicaid Services. 2022 Medicare Promoting Interoperability Program Requirements. Accessed May 2022. Available from: https://www.cms.gov/regulations-guidance/promoting-interoperability/2022-medicare-promoting-interoperability-program-requirements
- Office of the National Coordinator for Health Information Technology. Information Blocking FAQs. Available from https://healthit.gov/information-blocking/
- Richwine C., Marshall, C., Johnson C., & Patel, V. (September 2021). Challenges to Public Health Reporting Experienced by Non-Federal Acute Care Hospitals, 2019. ONC Data Brief, no.56. Office of the National Coordinator for Health Information Technology: Washington DC.
- Argentieri, R., Myers, E., Posnack, S., & Tripathi, M. (October 2021). Thinking Outside the Box: The USCDI+ Initiative. https://www.healthit.gov/buzz-blog/health-it/thinking-outside-the-box-the-uscdi-initiative.
- Office of the National Coordinator for Health Information Technology. Strengthening the Technical Advancement & Readiness of Public Health via Health Information Exchange Program (The STAR HIE Program). https://www.healthit.gov/topic/star-hie-program
- COVID-19 Guidance for Hospital Reporting and FAQs For Hospitals, Hospital Laboratory, and Acute Care Facility Data Reporting. (August 2022). https://www.hhs.gov/sites/default/files/covid-19-faqs-hospitals-hospital-laboratory-acute-care-facility-data-reporting.pdf
- Jessup, L., Perlie, L., Moossa, D., & Tessier, T. (May 2022). The STAR HIE Program Shines. Health IT Buzz Blog. https://www.healthit.gov/buzz-blog/
- Audacious Inquiry. Situational Awareness for Novel Epidemic Response. Available from: https://docs.google.com/viewer?url=https://github.com/AudaciousInquiry/fhir-saner/wiki/images/SANER_Project_Overview.pdf
Acknowledgements
The authors are with the Office of Technology, within the Office of the National Coordinator for Health Information Technology. The data brief was drafted under the direction of the Director, Mera Choi and Deputy Director, Vaishali Patel of the Technical Strategy and Analysis Division.
Suggested Citation
Richwine C., Everson, J., & Patel, V. (September 2022). Electronic Public Health Reporting among Non-Federal Acute Care Hospitals During the COVID-19 Pandemic, 2021. ONC Data Brief, no.62. Office of the National Coordinator for Health Information Technology: Washington DC.
Appendix
Appendix Table A1: Percent of non-federal acute care hospitals actively engaged in electronic public health reporting by state, 2021.
| State | Syndromic surveillance | Immunization registry | Electronic case | Public health registry | Clinical data registry | Electronic reportable laboratory result | # Hospitals in IT Survey | # Hospitals in State | % Hospitals Surveyed |
|---|---|---|---|---|---|---|---|---|---|
| AK | 82% | 82% | 44% | 66% | 39% | 82% | 5 | 26 | 19% |
| AL | 78% | 85% | 40% | 60% | 58% | 80% | 30 | 117 | 26% |
| AR | 90% | 92% | 45% | 48% | 49% | 85% | 43 | 104 | 41% |
| AZ | 92% | 90% | 14% | 24% | 61% | 72% | 31 | 112 | 28% |
| CA | 59% | 93% | 54% | 52% | 41% | 91% | 135 | 415 | 33% |
| CO | 65% | 85% | 63% | 65% | 54% | 77% | 52 | 106 | 49% |
| CT | 100% | 85% | 28% | 35% | 41% | 100% | 19 | 42 | 45% |
| DC | 54% | 100% | 54% | 54% | 54% | 84% | 6 | 14 | 43% |
| DE | 100% | 100% | 53% | 74% | 74% | 100% | 4 | 13 | 31% |
| FL | 98% | 100% | 61% | 78% | 29% | 95% | 134 | 252 | 53% |
| GA | 85% | 100% | 40% | 57% | 19% | 73% | 69 | 173 | 40% |
| HI | 25% | 46% | 41% | 58% | 62% | 46% | 10 | 28 | 36% |
| IA | 31% | 90% | 38% | 52% | 45% | 76% | 63 | 122 | 52% |
| ID | 92% | 81% | 47% | 55% | 32% | 92% | 11 | 52 | 21% |
| IL | 93% | 98% | 26% | 46% | 50% | 69% | 101 | 208 | 49% |
| IN | 93% | 95% | 24% | 52% | 56% | 92% | 66 | 161 | 41% |
| KS | 78% | 76% | 39% | 69% | 42% | 65% | 66 | 151 | 44% |
| KY | 84% | 88% | 44% | 82% | 20% | 76% | 36 | 121 | 30% |
| LA | 93% | 96% | 39% | 60% | 52% | 91% | 36 | 204 | 18% |
| MA | 83% | 100% | 49% | 62% | 51% | 94% | 38 | 102 | 37% |
| MD | 78% | 97% | 52% | 56% | 53% | 100% | 31 | 63 | 49% |
| ME | 71% | 78% | 26% | 69% | 69% | 86% | 23 | 39 | 59% |
| MI | 92% | 98% | 41% | 65% | 70% | 89% | 60 | 161 | 37% |
| MN | 59% | 97% | 66% | 66% | 76% | 72% | 86 | 140 | 61% |
| MO | 77% | 78% | 53% | 49% | 42% | 65% | 104 | 142 | 73% |
| MS | 80% | 54% | 23% | 42% | 33% | 66% | 32 | 112 | 29% |
| MT | 53% | 66% | 24% | 40% | 26% | 42% | 18 | 65 | 28% |
| NC | 94% | 58% | 54% | 42% | 51% | 71% | 62 | 136 | 46% |
| ND | 100% | 95% | 65% | 40% | 31% | 100% | 14 | 49 | 29% |
| NE | 81% | 87% | 23% | 61% | 47% | 84% | 37 | 100 | 37% |
| NH | 80% | 34% | 46% | 41% | 18% | 67% | 17 | 31 | 55% |
| NJ | 93% | 93% | 69% | 71% | 81% | 90% | 34 | 98 | 35% |
| NM | 83% | 90% | 13% | 57% | 15% | 58% | 19 | 55 | 35% |
| NV | 88% | 89% | 58% | 57% | 21% | 80% | 12 | 60 | 20% |
| NY | 92% | 95% | 43% | 63% | 58% | 92% | 84 | 208 | 40% |
| OH | 94% | 96% | 71% | 79% | 70% | 88% | 91 | 222 | 41% |
| OK | 51% | 66% | 53% | 58% | 52% | 63% | 51 | 146 | 35% |
| OR | 85% | 100% | 24% | 45% | 75% | 91% | 18 | 65 | 28% |
| PA | 99% | 96% | 51% | 76% | 75% | 83% | 94 | 230 | 41% |
| RI | 100% | 100% | 21% | 21% | 49% | 84% | 6 | 15 | 40% |
| SC | 74% | 84% | 55% | 68% | 41% | 58% | 29 | 89 | 33% |
| SD | 86% | 92% | 57% | 56% | 54% | 93% | 30 | 64 | 47% |
| TN | 90% | 100% | 38% | 69% | 31% | 77% | 42 | 131 | 32% |
| TX | 84% | 89% | 50% | 66% | 34% | 75% | 173 | 603 | 29% |
| UT | 43% | 49% | 36% | 38% | 2% | 45% | 34 | 59 | 58% |
| VA | 100% | 100% | 89% | 81% | 39% | 98% | 36 | 122 | 30% |
| VT | 65% | 100% | 36% | 35% | 100% | 82% | 8 | 17 | 47% |
| WA | 91% | 86% | 46% | 56% | 49% | 70% | 31 | 105 | 30% |
| WI | 87% | 94% | 49% | 54% | 56% | 89% | 87 | 150 | 58% |
| WV | 100% | 100% | 52% | 22% | 16% | 70% | 30 | 61 | 49% |
| WY | 66% | 61% | 11% | 48% | 31% | 31% | 16 | 32 | 50% |
Note: Missing values excluded from denominator. Non-active engagement includes hospitals that inidicated they were: “In the process of testing and validating electronic submission of data”; “Completed registration to submit data”; “Have not completed registration”; or “Don’t know”.
Appendix Table A2: Percent of hospitals that indicated their EHR developer charged separately to submit data for public health reporting activities, by developer, 2021.
| EHR Developer | Yes | No | Don’t know | No. of Hospitals |
|---|---|---|---|---|
| Epic | 14% | 75% | 11% | 980 |
| Athenahealth | 15% | 72% | 13% | 24 |
| Meditech | 15% | 76% | 9% | 408 |
| Other | 30% | 34% | 35% | 52 |
| Cerner | 35% | 43% | 22% | 508 |
| Allscripts | 36% | 55% | 9% | 119 |
| MEDHOST | 39% | 35% | 26% | 36 |
| CPSI/Evident | 43% | 39% | 19% | 150 |
| National Average | 23% | 62% | 14% | 2,277 |
Note: Missing values excluded from denominator. “Other” developers include EHR developers with less than 20 hospital clients (i.e., Azalea Health/Prognosis, GE, Harris Healthcare/QuadraMed, McKesson) as well as other developers, self-developed, and developers not disclosed by hospital respondents.
Appendix Table A3: HIE services provided during data submission among hospitals that use an HIE to submit data for at least one public health reporting activity, 2021.
| HIE Services Provided | Syndromic surveillance | Immunization registry | Electronic case reporting | Public health registry | Clinical data registry | Electronic reportable lab result | Hospital capacity |
|---|---|---|---|---|---|---|---|
| Value added services (e.g., adding information from another source) | 11% | 13% | 11% | 11% | 10% | 11% | 4% |
| Simple modifications (e.g., code translation) | 9% | 9% | 8% | 6% | 7% | 11% | 5% |
| Pass through or transmit only | 51% | 50% | 47% | 47% | 47% | 45% | 27% |
| Don’t know | 28% | 29% | 33% | 36% | 36% | 33% | 64% |
Note: Describes hospitals’ responses to the question: “If you use an HIE to submit data for public health reporting activities, does the HIE perform value added services during submission (e.g., reformat message, add additional data to message, etc.)?” Public health reporting estimates only include respondents that were “actively electronically submitting production data” for the respective reporting type. Hospital capacity reporting estimates include all respondents. For all reporting types, missing values and “Not applicable” responses were excluded from the denominator.
Appendix Table A4: Percent of hospitals in each state that use an HIE to submit data for at least one public health reporting activity, 2021.
| State | Use HIE for Public Health Reporting | N | # Hospitals in IT Survey | # Hospitals in State | % Hospitals Surveyed |
|---|---|---|---|---|---|
| AK | 46% | 2 | 5 | 26 | 19% |
| AL | 30% | 9 | 30 | 117 | 26% |
| AR | 44% | 18 | 43 | 104 | 41% |
| AZ | 64% | 20 | 31 | 112 | 28% |
| CA | 26% | 36 | 135 | 415 | 33% |
| CO | 62% | 34 | 52 | 106 | 49% |
| CT | 5% | 1 | 19 | 42 | 45% |
| DC | 83% | 5 | 6 | 14 | 43% |
| DE | 27% | 1 | 4 | 13 | 31% |
| FL | 17% | 25 | 134 | 252 | 53% |
| GA | 19% | 13 | 69 | 173 | 40% |
| HI | 56% | 6 | 10 | 28 | 36% |
| IA | 50% | 31 | 63 | 122 | 52% |
| ID | 25% | 3 | 11 | 52 | 21% |
| IL | 19% | 19 | 101 | 208 | 49% |
| IN | 78% | 52 | 66 | 161 | 41% |
| KS | 62% | 40 | 66 | 151 | 44% |
| KY | 87% | 32 | 36 | 121 | 30% |
| LA | 54% | 17 | 36 | 204 | 18% |
| MA | 62% | 24 | 38 | 102 | 37% |
| MD | 100% | 31 | 31 | 63 | 49% |
| ME | 71% | 17 | 23 | 39 | 59% |
| MI | 80% | 48 | 60 | 161 | 37% |
| MN | 51% | 44 | 86 | 140 | 61% |
| MO | 30% | 32 | 104 | 142 | 73% |
| MS | 30% | 10 | 32 | 112 | 29% |
| MT | 11% | 2 | 18 | 65 | 28% |
| NC | 40% | 25 | 62 | 136 | 46% |
| ND | 93% | 13 | 14 | 49 | 29% |
| NE | 62% | 23 | 37 | 100 | 37% |
| NH | 11% | 2 | 17 | 31 | 55% |
| NJ | 37% | 13 | 34 | 98 | 35% |
| NM | 65% | 13 | 19 | 55 | 35% |
| NV | 25% | 3 | 12 | 60 | 20% |
| NY | 29% | 25 | 84 | 208 | 40% |
| OH | 39% | 34 | 91 | 222 | 41% |
| OK | 39% | 19 | 51 | 146 | 35% |
| OR | 41% | 8 | 18 | 65 | 28% |
| PA | 47% | 46 | 94 | 230 | 41% |
| RI | 66% | 4 | 6 | 15 | 40% |
| SC | 28% | 8 | 29 | 89 | 33% |
| SD | 42% | 12 | 30 | 64 | 47% |
| TN | 30% | 14 | 42 | 131 | 32% |
| TX | 24% | 43 | 173 | 603 | 29% |
| UT | 64% | 24 | 34 | 59 | 58% |
| VA | 39% | 17 | 36 | 122 | 30% |
| VT | 64% | 5 | 8 | 17 | 47% |
| WA | 54% | 14 | 31 | 105 | 30% |
| WI | 28% | 24 | 87 | 150 | 58% |
| WV | 84% | 26 | 30 | 61 | 49% |
| WY | 58% | 9 | 16 | 32 | 50% |
Note: HIE use for at least one type of public health reporting was determined based on responses to the question:“If you use an HIE to submit data for public health reporting activities, does the HIE perform value added services during submission?” Any responses to this question, including “don’t know”, were counted as using an HIE for public health reporting. Missing values and “not applicable” responses were counted as not using an HIE for any public health reporting.
Appendix Table A5: Percent of non-federal acute care hospitals in each state that use automated processes to transmit data for the following types of public health reporting, 2021.
| State | Syndromic surveillance | Immunization registry | Electronic case | Public health registry | Clinical data registry | Electronic reportable laboratory result | # Hospitals in IT Survey | # Hospitals in State | % Hospitals Surveyed |
|---|---|---|---|---|---|---|---|---|---|
| AK | 100% | 73% | 100% | 100% | 100% | 100% | 5 | 26 | 19% |
| AL | 86% | 84% | 41% | 51% | 63% | 82% | 30 | 117 | 26% |
| AR | 97% | 97% | 86% | 79% | 75% | 97% | 43 | 104 | 41% |
| AZ | 100% | 100% | 83% | 70% | 77% | 95% | 31 | 112 | 28% |
| CA | 86% | 97% | 67% | 64% | 72% | 91% | 135 | 415 | 33% |
| CO | 95% | 96% | 69% | 87% | 57% | 92% | 52 | 106 | 49% |
| CT | 100% | 100% | 77% | 100% | 100% | 100% | 19 | 42 | 45% |
| DC | 35% | 49% | 35% | 35% | 35% | 59% | 6 | 14 | 43% |
| DE | 100% | 73% | 100% | 100% | 100% | 100% | 4 | 13 | 31% |
| FL | 92% | 93% | 80% | 92% | 69% | 92% | 134 | 252 | 53% |
| GA | 93% | 97% | 89% | 90% | 74% | 98% | 69 | 173 | 40% |
| HI | 100% | 100% | 72% | 84% | 74% | 100% | 10 | 28 | 36% |
| IA | 77% | 90% | 68% | 68% | 65% | 90% | 63 | 122 | 52% |
| ID | 100% | 71% | 78% | 67% | 34% | 89% | 11 | 52 | 21% |
| IL | 99% | 98% | 82% | 86% | 49% | 93% | 101 | 208 | 49% |
| IN | 99% | 99% | 16% | 14% | 48% | 98% | 66 | 161 | 41% |
| KS | 92% | 84% | 74% | 83% | 66% | 85% | 66 | 151 | 44% |
| KY | 88% | 88% | 50% | 79% | 33% | 77% | 36 | 121 | 30% |
| LA | 87% | 92% | 62% | 77% | 72% | 75% | 36 | 204 | 18% |
| MA | 100% | 100% | 54% | 65% | 78% | 97% | 38 | 102 | 37% |
| MD | 64% | 100% | 100% | 100% | 91% | 100% | 31 | 63 | 49% |
| ME | 92% | 100% | 77% | 62% | 0% | 93% | 23 | 39 | 59% |
| MI | 96% | 96% | 94% | 95% | 79% | 79% | 60 | 161 | 37% |
| MN | 58% | 97% | 48% | 66% | 47% | 66% | 86 | 140 | 61% |
| MO | 82% | 81% | 72% | 69% | 61% | 81% | 104 | 142 | 73% |
| MS | 96% | 80% | 34% | 27% | 22% | 86% | 32 | 112 | 29% |
| MT | 89% | 90% | 25% | 61% | 32% | 53% | 18 | 65 | 28% |
| NC | 88% | 71% | 85% | 92% | 31% | 94% | 62 | 136 | 46% |
| ND | 87% | 90% | 92% | 87% | 83% | 87% | 14 | 49 | 29% |
| NE | 89% | 88% | 73% | 67% | 59% | 92% | 37 | 100 | 37% |
| NH | 94% | 100% | 86% | 68% | 67% | 93% | 17 | 31 | 55% |
| NJ | 100% | 97% | 84% | 95% | 79% | 100% | 34 | 98 | 35% |
| NM | 88% | 95% | 60% | 30% | 65% | 65% | 19 | 55 | 35% |
| NV | 94% | 100% | 91% | 100% | 100% | 94% | 12 | 60 | 20% |
| NY | 95% | 92% | 75% | 71% | 64% | 91% | 84 | 208 | 40% |
| OH | 93% | 94% | 85% | 76% | 78% | 95% | 91 | 222 | 41% |
| OK | 54% | 62% | 49% | 44% | 52% | 61% | 51 | 146 | 35% |
| OR | 100% | 100% | 100% | 100% | 80% | 100% | 18 | 65 | 28% |
| PA | 98% | 91% | 54% | 48% | 31% | 77% | 94 | 230 | 41% |
| RI | 100% | 100% | 100% | 100% | 100% | 100% | 6 | 15 | 40% |
| SC | 91% | 91% | 82% | 100% | 0% | 93% | 29 | 89 | 33% |
| SD | 100% | 96% | 100% | 100% | 30% | 96% | 30 | 64 | 47% |
| TN | 86% | 92% | 74% | 70% | 0% | 89% | 42 | 131 | 32% |
| TX | 89% | 82% | 57% | 59% | 50% | 90% | 173 | 603 | 29% |
| UT | 100% | 100% | 100% | 90% | 100% | 95% | 34 | 59 | 58% |
| VA | 98% | 100% | 94% | 59% | 21% | 100% | 36 | 122 | 30% |
| VT | 100% | 82% | 100% | 100% | 72% | 79% | 8 | 17 | 47% |
| WA | 87% | 83% | 60% | 57% | 78% | 83% | 31 | 105 | 30% |
| WI | 96% | 97% | 68% | 78% | 92% | 91% | 87 | 150 | 58% |
| WV | 100% | 100% | 91% | 60% | 26% | 94% | 30 | 61 | 49% |
| WY | 89% | 73% | 0% | 48% | 75% | 100% | 16 | 32 | 50% |
Source: AHA Annual Survey Information Technology Supplement.
Note: Missing values and “don’t know” responses excluded from denominator. Estimates only include respondents that were “actively electronically submitting production data” for the respective reporting type.
Appendix Table A6: Percent of non-federal acute care hospitals in each state that successfully submit vaccine related adverse events to relevant State and Federal agencies, 2021.
| State | Successful VAE Submission | N | # Hospitals in IT Survey | # Hospitals in State | % Hospitals Surveyed |
|---|---|---|---|---|---|
| AK | 77% | 4 | 5 | 26 | 19% |
| AL | 76% | 23 | 30 | 117 | 26% |
| AR | 82% | 36 | 43 | 104 | 41% |
| AZ | 77% | 25 | 31 | 112 | 28% |
| CA | 81% | 111 | 135 | 415 | 33% |
| CO | 80% | 44 | 52 | 106 | 49% |
| CT | 68% | 13 | 19 | 42 | 45% |
| DC | 84% | 5 | 6 | 14 | 43% |
| DE | 79% | 3 | 4 | 13 | 31% |
| FL | 86% | 112 | 134 | 252 | 53% |
| GA | 53% | 36 | 69 | 173 | 40% |
| HI | 74% | 8 | 10 | 28 | 36% |
| IA | 60% | 38 | 63 | 122 | 52% |
| ID | 90% | 10 | 11 | 52 | 21% |
| IL | 71% | 74 | 101 | 208 | 49% |
| IN | 90% | 61 | 66 | 161 | 41% |
| KS | 68% | 45 | 66 | 151 | 44% |
| KY | 68% | 24 | 36 | 121 | 30% |
| LA | 60% | 21 | 36 | 204 | 18% |
| MA | 61% | 23 | 38 | 102 | 37% |
| MD | 65% | 21 | 31 | 63 | 49% |
| ME | 70% | 16 | 23 | 39 | 59% |
| MI | 71% | 44 | 60 | 161 | 37% |
| MN | 83% | 71 | 86 | 140 | 61% |
| MO | 75% | 80 | 104 | 142 | 73% |
| MS | 44% | 15 | 32 | 112 | 29% |
| MT | 29% | 6 | 18 | 65 | 28% |
| NC | 72% | 44 | 62 | 136 | 46% |
| ND | 82% | 12 | 14 | 49 | 29% |
| NE | 71% | 26 | 37 | 100 | 37% |
| NH | 68% | 12 | 17 | 31 | 55% |
| NJ | 90% | 31 | 34 | 98 | 35% |
| NM | 76% | 14 | 19 | 55 | 35% |
| NV | 90% | 11 | 12 | 60 | 20% |
| NY | 67% | 56 | 84 | 208 | 40% |
| OH | 88% | 81 | 91 | 222 | 41% |
| OK | 52% | 27 | 51 | 146 | 35% |
| OR | 83% | 15 | 18 | 65 | 28% |
| PA | 81% | 79 | 94 | 230 | 41% |
| RI | 57% | 3 | 6 | 15 | 40% |
| SC | 78% | 23 | 29 | 89 | 33% |
| SD | 88% | 27 | 30 | 64 | 47% |
| TN | 82% | 35 | 42 | 131 | 32% |
| TX | 74% | 132 | 173 | 603 | 29% |
| UT | 92% | 32 | 34 | 59 | 58% |
| VA | 94% | 34 | 36 | 122 | 30% |
| VT | 37% | 3 | 8 | 17 | 47% |
| WA | 65% | 21 | 31 | 105 | 30% |
| WI | 82% | 73 | 87 | 150 | 58% |
| WV | 76% | 23 | 30 | 61 | 49% |
| WY | 64% | 10 | 16 | 32 | 50% |
Note: Responses were recoded from hospitals’ responses to the question: “To what extent do you agree with this statement: We have been successfully submitting vaccine related adverse events to relevant State and Federal agencies?” Successful submission was defined as those who indicated they “Agree” or “Strongly Agree” with the statement, whereas those who “Disagree”, “Strongly Disagree” or “Don’t know” were considered unsuccessful. Missing values were excluded from the denominator.